
PROJECT CASE STUDY
Oil Prices Dashboard
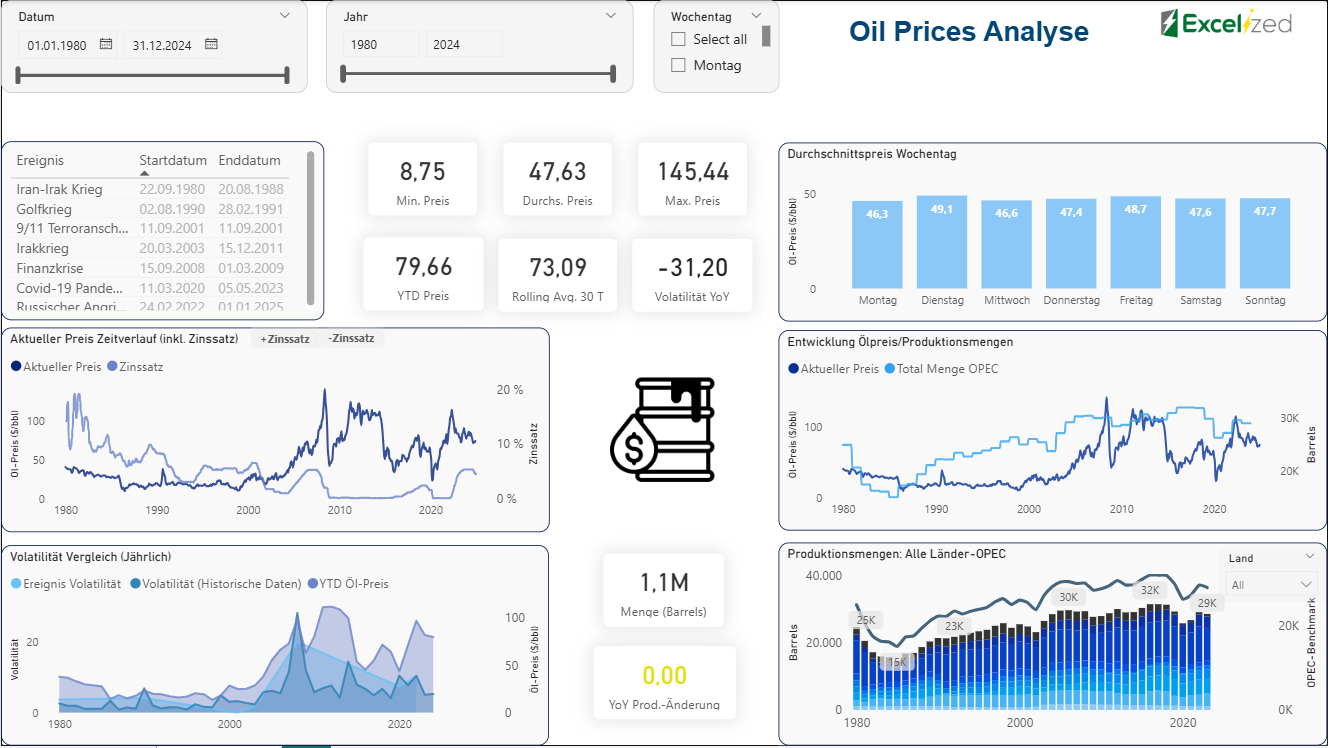
An interactive Power BI report for tracking oil-price development, market events, interest rates, volatility, and OPEC production.
The challenge
Historical price data and related market drivers needed to be brought into one report that supported both a management overview and deeper analysis.
The solution
A filterable Power BI dashboard was designed with clear KPIs, time-series analysis, commodity and regional views, and a live connection to price-feed data.
The outcome
The report refreshes automatically each day and replaced a manual price-tracking task that previously took about 30 minutes per day. The project was delivered in 10 days.