Excel Currency Converter & FX Dashboard – How‑to (Free download)
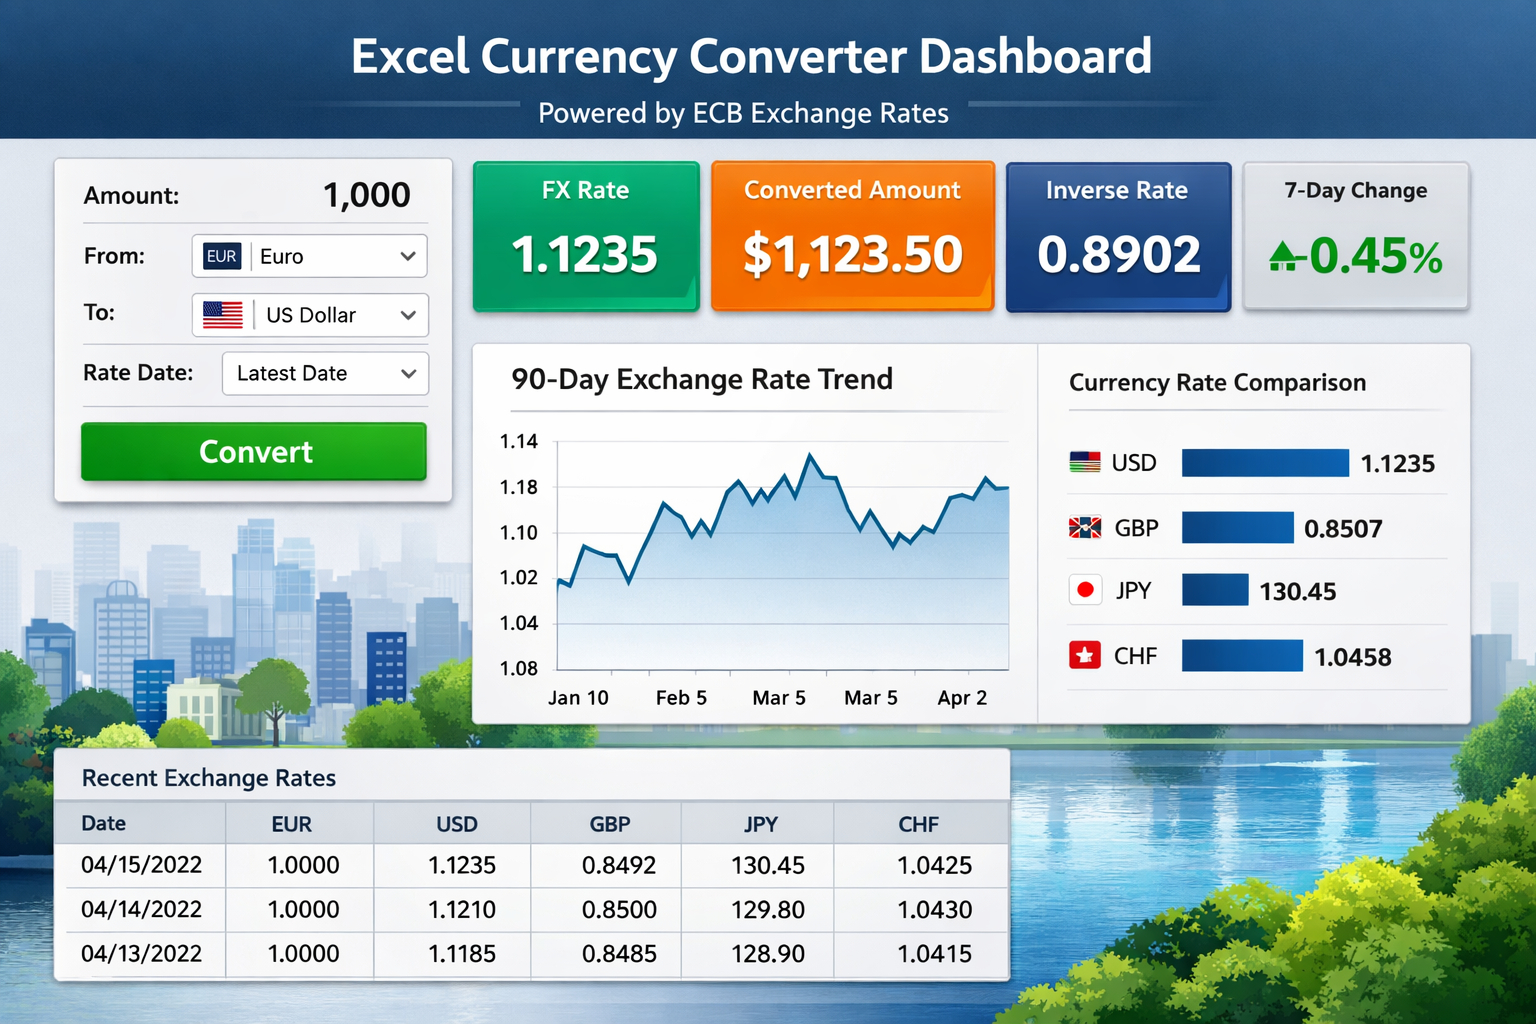
A ready-to-use Excel currency converter with a 90-day FX history, dropdown filters, KPI cards, and two interactive charts. Free download included with step-by-step setup instructions.
What you got
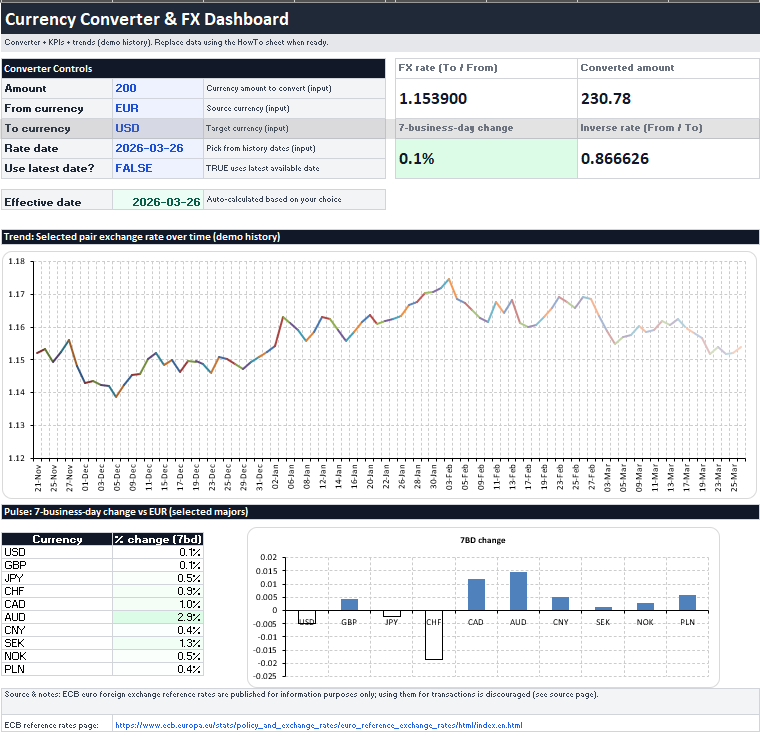
Dashboard: dropdown controls + KPI cards + 2 charts.
Data: an example 90‑business‑day history laid out as Date + currency columns (1 EUR = X).
Lists: currency codes and names used for dropdowns.
HowTo (in the workbook): a copy of the key update steps.
Note: The workbook ships with demo history so everything works immediately. You can replace it with real data whenever you want.
Check out some of our FREE templates and materials.
PRACTICE MATERIAL BELOW!👇
1) Use the converter (fast)
Open Dashboard.
Fill in:
Amount
From currency
To currency
Rate date (optional)
If you want the newest date, set Use latest date? to TRUE.
The dashboard calculates:
FX rate (To / From)
Converted amount
Inverse rate
7‑business‑day change
2) How the conversion works (in plain terms)
All stored rates are per EUR (ECB convention):
1 EUR = X USD
1 EUR = Y JPY
To convert From → To, the dashboard uses the cross‑rate:
Converted = Amount × (To_per_EUR / From_per_EUR)
3) Replace demo data with real ECB data (recommended)
The easiest, most Excel‑friendly approach is Power Query.
A) Pull the data
Excel → Data → Get Data → From Other Sources → From Web.
Paste the ECB Data Portal endpoint (example: daily rates vs EUR, last 90 observations):
In Power Query:
If it asks, choose CSV.
If you need to force it, set the request header Accept to text/csv.
B) Load into this workbook
Load the query result into the Data sheet starting at A4.
Keep the header row as:
Date in column A
Currency codes across the columns (EUR, USD, GBP, …)
Refresh:
Data → Refresh All
Download file here:
4) Customize (easy wins)
Add currencies: extend the Lists table and add matching columns in Data.
Add KPIs: duplicate a KPI card and point it at a new helper calculation.
Change chart focus: update the currency lists used for the bar chart.
5) Practical tip for finance/accounting
If you’re doing financial reporting, keep a saved snapshot of the rate table you used (date/time stamped) so you can reproduce historical conversions later.
If you found this guide useful, explore the related posts below or download a free Power Query cheat sheet by subscribing to the Excelized newsletter.

👉 Want to learn this hands-on? Book a live 1:1 Excel Basic Course and go from raw data to confident reporting.